Hansen Solubility Parameters in Practice (HSPiP) e-Book Contents
(How to buy HSPiP)
Chapter 18, Gloves:
from minimum data to maximum insight (Exploring Glove Permeation)
The real
world is often full of incomplete data. Like it or not, we have to make
decisions with the data we’ve got. This chapter extends the theme from the
previous one and shows how HSPiP can take imperfect data and with some good
theory, a good modeler and some persistence, create some solid understanding of
an important topic – the solvent resistance of gloves.
There are
two inter-related criteria for judging the safety of gloves: the breakthrough
time and the steady state permeation rate (SSPR). As we will see, ASTM judge
the breakthrough time when the permeation rate reaches a certain limit. To
understand the importance of HSP for the performance of protective gloves,
we’ll remind ourselves of the equation for the SSPR.
SSPR = Dav(C1
– C2)/L
[g/cm2/s ]
Dav
= D0Dlm
[cm2/s]
C1
is the surface concentration (g/cm3 dry polymer), C2 is assumed to be zero, D0
is the diffusion coefficient (cm2/s) at essentially zero
concentration (or where the diffusion coefficient is indeed a constant), and L
is the (dry) film thickness (cm). The log mean average of the diffusion
coefficients at C1 and C2, is called Dlm. This accounts for changing diffusion
coefficients within the film from Dmax at the exposed side to D0
at side 2 for a typical exponential dependence on concentration:
Dlm
= (Dmax/D0 – 1)/ln(Dmax/D0) [dimensionless]
HSP
immediately affect the SSPR because the surface concentration is higher for a
better HSP match. This surface concentration is almost always assumed to be the
equilibrium concentration as measured by swelling tests (but see below for
acetonitrile in Viton for a case where it is not).
Although we
know that HSP don’t affect D directly (for similar molecular shapes, a molecule
with a bad HSP match will diffuse at the same speed as one with a good match),
D can increase greatly as the concentration increases, so a good HSP match
indirectly leads to a high D through this effect.
When D is
concentration dependent, calculations are best done with a full-scale modeler
such as the one in HSPiP. But if you are keen to do things from formulæ
then it is possible to calculate the steady state permeation rate using those
given above.
The
breakthrough times also have the double dependency on polymer solubility and
therefore a double dependency on HSP. Fortunately the HSPiP diffusion modeler
can readily handle this complex situation. The main problems are connected with
getting the correct data to put into the calculations. There is very little
information in the protective clothing literature on diffusion coefficients,
much less how they change with the local concentration.
Estimates
of the equilibrium swelling concentrtion and D are required to understand what
is going on within the glove, and when to be concerned with events on the
“safe” side of the protective elastomeric film. When such data are lacking,
simple but judicious use of HSP correlations of swelling, breakthrough times,
or permeation rates are fully justified, because of the very close connection
between the HSP and these phenomena. That’s the logic behind the choice of
gloves in “It’s your call”.
Help in
estimating D0 for a given chemical can be found in Figure 1. This
figure ranks (from top left to bottom right) the amount of solvent retained in
vinyl and acrylic films for very long times (months). This is, in effect, a
ranking of their diffusion coefficients at low concentration and essentially
the same ranking will be found in films made from different polymers. It is the
activation energy required to cause polymer chain segmental motion that
determines how readily suitable free volume becomes available for movement of
the solvent molecule. These activation energies will be different for different
polymers, but the ranking of solvent diffusion coefficients will not change
significantly. The larger, cyclic and branched molecules will require more free
volume in order to move in any polymer so there is a larger activation energy
for these molecules than for smaller and more linear molecules. Figure 1
provides a method to interpolate/extrapolate diffusion coefficients (D0)
on a relative basis in any polymer. The key thing to remember is that although
the relative order will remain constant between polymers, the size of the
effect will be highly polymer dependent. In a very rigid polymer the difference
in diffusion rates between large and small molecules will be much larger than
for a highly flexible polymer. The ranking by Shell reported in the Factor 4
section of the Diffusion chapter provided independent confirmation of this
fact.
Figure 1‑1 Relative
solvent retention in vinyl and acrylic films as a function of the size and
shape of the solvent molecules. (Source: Hansen, C.M., Doctoral Dissertaton,
Technical University of Denmark, 1967, available as a PDF file on www.hansen-solubility.com by clicking on the cover page).
Cyclohexyl chloride is retained more than cyclohexanone which is retained more
than diacetone alcohol, etc. with methanol being the solvent that gets out
fastest.
Analysis of permeation data to estimate the
diffusion coefficient concentration profile
Diffusion
coefficients must be low if a glove is to offer good protection. This implies
that either the HSP match must be (very) poor to keep the surface concentration
(equilibrium swelling amount) down, or else the challenge chemical has a large
molecular size.
Because we
don’t have all the required data to hand in order to explain permeation rates
and breakthrough times we have to find a rational process for providing
adequate fits to whatever data are available. The trick is to find
(concentration dependent) diffusion coefficients and (hopefully from
independent measurements) surface concentrations that fit both the equilibrium permeation rates and the breakthrough times. Experience shows that the room for
adjusting the parameters to attain good simultaneous fits is surprisingly
small, giving confidence that the resulting values are meaningful.
When inputting
the concentration dependent diffusion coefficients there is no strict
requirement to enter values for concentrations above the surface concentration.
However it is good practice to make sure that the curve covers the whole range
smoothly up to 100% solvent which of course is limited to some value below that
for the self-diffusion coefficient since the diffusion coefficients used in the
modeler are based on dry film thickness. As shown in the first figure of the
diffusion chapter, the diffusion coefficients based on dry film thickness will
be somewhat lower than those based on total film thickness. At 100% solvent the
diffusion coefficient based on a dry film thickness becomes meaningless. This
does not significantly affect the results within the concentration range of
usual interest, but should be recognized when solvent concentrations become
very high.
We have
used permeation data reported in the Chemical
Protective Clothing Performance Index, Second Edition, by Krister Forsberg
and Lawrence N. Keith (abbreviated F/K). Data from other sources have been used
as a supplement to these. The major problem with the F/K data is the lack of
information on the surface concentration from equilibrium swelling experiments.
A second problem is that the criterion for the breakthrough time is not given.
The work reported here started with a breakthrough time defined at having a
concentration on side 2 of the glove equal to 0.1% of the equilibrium
solubility. This was supplemented by use of the ASTM F739-99a criterion for
breakthrough which is a permeation rate of 0.1μg/cm2/min. This is equal
to 1.67E-09 g/cm2/s, the units used by the HSPiP modeler.
In the
figures below the red line reports the permeation rate at the given time. These
values can be read accurately using the mouse over the graph, allowing
interpolation to find the ASTM breakthrough time. Values defining the diffusion
coefficient profiles were systematically changed until simultaneous agreement
was found with both the reported breakthrough time and reported permeation
rate. Excellent agreement of this kind could be found in all cases reported
below for Nitrile, Butyl, Neoprene, Viton, and Natural Rubber gloves. In one
case discussed in detail below (acetonitrile in Viton) it was necessary to
include a significant surface condition effect to greatly improve the match
with the literature data. A significant surface condition delays the
breakthrough while not (necessarily) affecting the steady state permeation
rate. It was possible to match permeation data in F/K for natural rubber in
some cases, but the data for methanol, as discussed below, are difficult to
make consistent.
Our use of
specific glove types in the following examples is merely so that the interested
reader can identify the specific data from F/K. They, in turn, emphasize that
the “same” glove (e.g. “Nitrile”) from different manufacturers can have
different properties – though we’ve tried to ensure that our examples are
of gloves that are within the normal range expected of each type.
In all the
figures that follow, the blue line gives the percentage of the saturated amount
in the glove. The red line follows the permeation rate to the equilibrium condition.
Toluene permeation in Nitrile glove Ansell
Edmont type 37-165
Insight
into the mechanism by which the Ansell Edmont Nitrile glove type 37-165
protects against toluene is provided by Figure 2. The F/K data are:
Breakthrough time 61 minutes, permeation rate 4000 mg/m2/min, and
thickness 0.64 mm. The equilibrium uptake of toluene in this glove type is 0.67
volume fraction (private communication from Dr. Jaime Lara, IRSST, Montreal).
Figure 2 was generated using these data by assuming different diffusion
coefficient profiles as a function of concentration. The range of possibilities
among the variables is surprisingly limited. Emphasis was given to the perfect
calculated match of the experimental permeation rate of 6.68E-06 g/cm2/s.
Less emphasis was given to a simultaneous match of the breakthrough time
because the experimental determination can hardly be expected to exactly match
the 0.1% concentration assumption for breakthrough which gave a time of 64.3
minutes. The results found when matching the data using the ASTM breakthrough
criterion are discussed below. The agreement is surprisingly good in both cases.
A very interesting aspect is the diffusion coefficient profile. A straight line
on the log D versus volume fraction plot starting at D0 equal 1.15E-08
cm2/s and ending at 1.1E-06 cm2/s at the surface
concentration was required to match the performance data. The whole permeation process
occurs in an elastomeric diffusion region. It can also be seen that further
extrapolation of this straight line to the pure liquid gives a diffusion
coefficient near 1E-05 cm2/s which is very close to that expected
for the pure liquid. This self-consistency is also an important consideration
for a correct estimate.
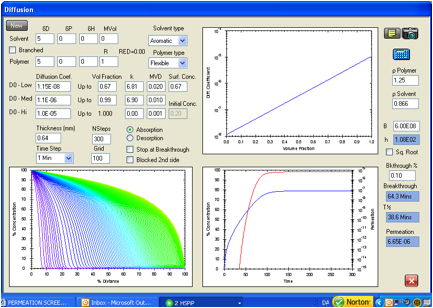
Figure 1‑2 HSPiP model
for the permeation of toluene in the Ansell Edmont Nitrile glove type 37-165.
The literature data indicate an equilibrium permeation rate of 6.68E-06 g/cm2/s
versus 6.65E-06 g/cm2/s in this analysis. The literature indicates a
breakthrough time of 61 minutes by an unspecified experimental technique while
this calculation gives 64.3 minutes. The criterion here is when the
concentration at side 2 reaches 0.1% of the surface concentration (saturated
swelling amount) on the exposed side.
Dibutyl phthalate permeation in Nitrile glove Ansell
Edmont type 37-165
Figure 3
indicates what might be expected from a larger challenge chemical such as the
plasticizer dibutyl phthalate. Here the D0 is taken as 1E-09 cm2/s
extending linearly as the logarithm of D to the pure liquid where the diffusion
coefficient is taken as being similar to that for many viscous liquids at 1E-06
cm2/s. The surface concentration is based on an assumed degree of
swelling of 500% that is typical for “good” solvents for this elastomer. The
breakthrough time is 6.3 hours compared with the F/K data for the system which
simply states >360 minutes. This shows that such low diffusion coefficients
are not usually of greatest interest to protective clothing. To reduce costs
there is room for adjusting other parameters such as film thickness,
composition, crosslinking, etc. while still maintaining acceptable safety. What
this calculation has shown is that D0 is not larger than 1E-09 cm2/s,
and probably is much lower depending on the actual breakthrough time.
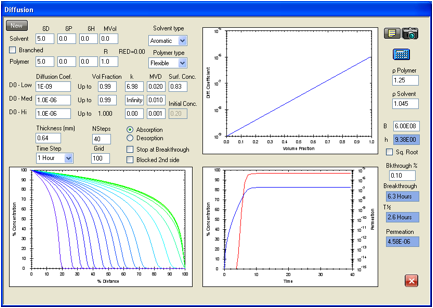
Figure 1‑3 HSPiP model
for the permeation of dibutyl phthalate in the Ansell Edmont Nitrile glove type
37-165. The literature data indicate an equilibrium permeation rate of <1.5E-05
g/cm/s which is easily satisfied by the 4.58E-06 g/cm/s found here. The
literature indicates a breakthrough time of >6 hours by an unspecified
experimental technique while this calculation gives 6.3 hours. The criterion
used here is when the concentration at side 2 reaches 0.1% of the surface
concentration (saturation swelling amount) on the exposed side. The diffusion
coefficients could be lower than those indicated in the figure.
Figure 3
also provides insight into what happens with a short term exposure for such
large molecules. There is a possibility for considerable absorption at shorter
times, which also strongly suggests that desorption of plasticizers into
challenge liquids will also occur to a significant extent near the surface,
even for shorter exposure times. The reason for this remark will become clear
when we discuss the Butyl glove below. The first curve in the lower left hand
figure for concentration versus distance is for an exposure time of about 12
minutes, where the uptake is 15% of the saturation value with a penetration
depth at about 20% of the film thickness (0.64 mm).
The F/K
data collection does list one Nitrile glove type, North LA.142G, where the
breakthrough time for dibutyl phthalate is given as >960 minutes for a
thickness of 0.33 mm. An analysis similar to the one above suggests the D0
in this case is less than 4E-13 cm2/s for the same surface
concentration. It is quite possible that this value is too low. The long
breakthrough time with the thinner film could be caused by a lower surface
concentration possibly supplemented by a stiffer glove material. Lowering the
surface concentration to 0.6 volume fraction and use of a D0 equal
to 1E-10 cm2/s gives a breakthrough time of 18.3 hours,
just exceeding the breakthrough time requirement.
Methanol permeation in Nitrile glove Ansell
Edmont type 37-165
The
permeation of methanol in the Ansel Edmont Nitrile glove type 37-165 is
analyzed in Figure 4. The F/K data source gives a breakthrough time of 11
minutes with a permeation rate <9000 mg/m2/min, which converts to
<1.5E-05 g/cm2/s. The equilibrium swelling (data, again, from Dr
Lara) is 0.32 volume fraction which is taken as the surface concentration. The
self-diffusion coefficient for methanol is close to 1.8E-05 cm2/s.
Figure 4 shows a breakthrough time of 11.3 minutes and a permeation rate of
3.09E-06 g/cm/s. This permeation rate is far below the limit given above, and
presumably is a good estimate of the actual rate. This is, again, an advantage
of the mathematical modeling, because some permeation rate values may still be
important, but may not be measurable. These can be reasonably estimated with
limited knowledge of the system. D0 is found as 2.4E-07 cm2/s,
in agreement with expectations related to very small, linear molecules.
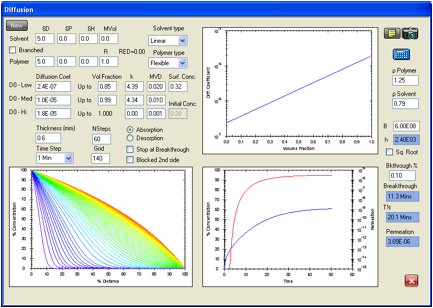
Figure 1‑4 HSPiP model
for the permeation of methanol in the Ansell Edmont Nitrile glove type 37-165.
The literature data indicate an equilibrium permeation rate of <1.5E-05 g/cm2/s
which is in agreement with the 3.09E-06 g/cm2/s in this analysis.
The
literature indicates a breakthrough time of 11 minutes by an unspecified
experimental technique while this calculation gives 11.3 minutes. The criterion
here is when the concentration at side 2 reaches 0.1% of the surface
concentration on the exposed side.
Toluene permeation in Butyl rubber glove Best
Company 878
Butyl
rubber consists of about 98% isobutene and 2% isoprene with some variation in
composition between different sources. It is widely used for chemical
protective gloves because of excellent resistance to commonly used chemicals.
These calculations used the data of Evans et.al.(Katherine M. Evans, Wumin Guo,
and James Hardy, Modeling Solubility
Parameters and Permeation Data of Organic Solvents Versus Butyl Gloves from
Four Manufacturers, J. Appl. Poly. Sci., Vol. 109, 3867-3877 (2008)). This
is a very complete study and again there is significant variation among the
suppliers. We use their toluene data for the Best company type 878 glove in
order to show the differences between Butyl rubber and the Nitrile glove
studied above. The targets are a breakthrough time of 26.8 minutes (ASTM
criterion) and a permeation rate of 1.29E-05 g/cm2/s. The
equilibrium solubility is essentially the same as in the nitrile gloves at
0.865 volume fraction. Because of the almost identical solubility, it can
immediately be seen that the diffusion coefficients will be higher for this Butyl
glove than for the Nitrile glove discussed in the above. This is because the
breakthrough time is shorter for a somewhat thicker film (0.75 mm versus
0.64mm).
A factor of
some apparent importance for the performance of this glove type is that Evans
et.al. found about 19 percent weight loss after careful removal of all solvent
absorbed during the permeation testing. The glove contains about 19%
plasticizing material. During a permeation test some of this plasticizing
material will be partly removed from the exposed surface, thus reducing the
inherent diffusion coefficient(s) attributable to the original material in this
region.
The
diffusion coefficients at concentrations just under the surface concentration
were lowered in an attempt to simulate removal of plasticizer from the surface
region of the glove. This was done by using a break in the diffusion
coefficient profile at a concentration below the surface concentration. This
lower slope at higher concentrations allows better fits of the experimental
data than for the previously used straight line profiles, indirectly confirming
the loss of some plasticizer.
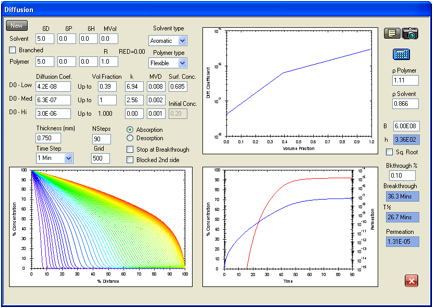
Figure 1‑5 Permeation
of toluene in the Best company glove type 878. The break in the diffusion
coefficient profile gives a better fit of the data, and could reflect migration
of plasticizer from the glove to the toluene. The ASTM criterion give a
breakthrough time of 26.7 minutes versus the target 26.8 minutes. The target
permeation rate of 1.29E-05 g/cm2/s is well matched by the
calculated permeation rate of 1.31E-05 g/cm2/s
Figures 6
and 7 repeat the examples reported in Figures 2 and 4, but with the ASTM
criterion as a target for the breakthrough time. For comparison the ASTM
breakthrough criterion would give breakthrough times for toluene in the Nitrile
glove in Figure 2 equal to 56.8 minutes and for methanol in the Nitrile glove
in Figure 4 equal to 5.7 minutes.
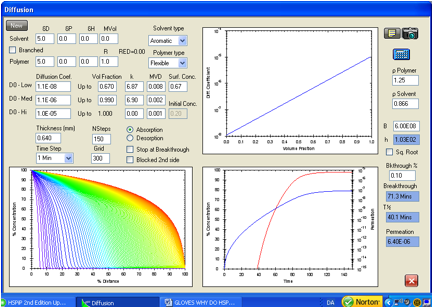
Figure 1‑6 Repeat of
the permeation calculation for toluene in the Ansell Edmont Nitrile glove type
37-165. The ASTM criterion for breakthrough gives 60.7 minutes by interpolation
of the red curve to a permeation rate of 1.67E-09 g/cm2/s. The
target is 61 minutes. The diffusion coefficient profile is essentially
unchanged from that used above in Figure 2. The equilibrium permeation rate is
6.4E-06 g/cm2/s. This is very close to the target value of 6.68E-06
g/cm2/s. Note that the grid line density is extended to 300.
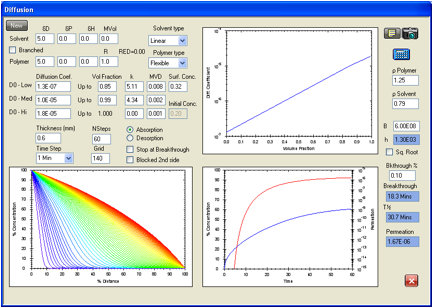
Figure 1‑7 Repeat of
the permeation calculation for methanol in the Ansell Edmont Nitrile glove type
37-165. The ASTM criterion for breakthough times gives 11.3 minutes to compare
with the 11 minutes given in the Forsberg/Kieth performance handbook. The
permeation rate of 1.67E-06 g/cm2/s is much lower than the <1.5E-05
g/cm2/s required by the data. D0 has been decreased from
2.4E-07 cm2/s to 1.3E-07 cm2/s to accommodate the change
in the breakthrough criterion while maintaining the same equilibrium permeation
rate.
Acetone permeation in Natural Rubber gloves
There are
data in the F/K Chemical Protective Clothing Performance Index for the
permeation of many different chemicals through natural rubber gloves, but many
chemicals degrade the natural rubber. It should perhaps be noted again that
there is wide variation in performance among the gloves. Solubility data
provided by Dr. Lara have been used to try to select a system to study where
the solubility is not too high. The glove type for which solubility data is
available is Ansell 356, but this glove type is not included in the F/K source.
This glove has a solubility of acetone equal to 0.162 volume fraction.
Figure 8
below matches the target breakthrough time (5 minutes) very well at 5.3 minutes
with a permeation rate of 1.71E-06 g/cm2/s where the target is 1.84E-06
g/cm2/s. This is good agreement, and shows that reasonable estimates
can be used to develop the diffusion coefficient profiles in natural rubber.
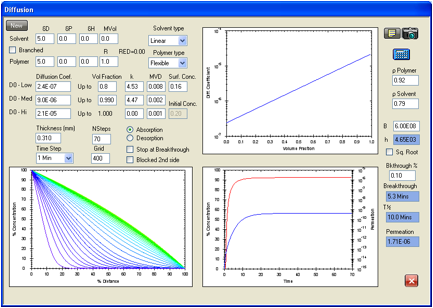
Figure 1‑8 Permeation
of Acetone in natural rubber. F/K data used are for Ansell Edmont 46-320. The
breakthrough time for this glove type in the F/K data is 5 minutes for a
permeation rate of 1.837E-06 g/cm2/s.
Methanol permeation in Natural Rubber gloves
The F/K
data source shows a wide variety of data for the permeation of methanol through
different glove qualitites. Ansell Edmont glove 46-320 was selected for this
study. The reported breakthrough time is 20 minutes and the permeation rate is
1.34E-07 g/cm2/s for a thickness of 0.31 mm. The results in Figure 9
for a surface concentration given by Dr Lara as 0.086 volume fraction are in
excellent agreement with the literature data. The diffusion coefficient profile
yielded an ASTM breakthrough time of 20.0 minutes. The calculated permeation
rate is 1.32E-07 g/cm2/s.
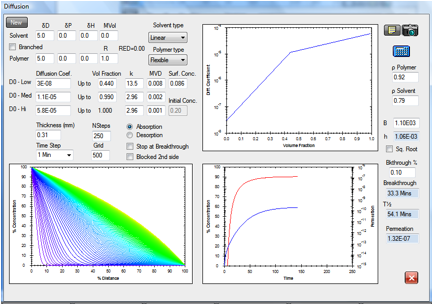
Figure 1‑9 Permeation
of methanol in Natural Rubber. The given diffusion coefficient profile yielded
an ASTM breakthrough time of 20 minutes versus the reported value of 20.0
minutes. The calculated permeation rate is 1.32E-07 g/cm2/s versus
the reported value 1.34E-07 g/cm2/s.
It should
be noted here that the methanol permeation data for some glove types could not
be matched. An example of such a situation is Ansell Orange 208. The reported
breakthrough time is 17 minutes, not far from that in the previous example, but
the permeation rate is reported as 1.5E-09 g/cm2/s. This permeation
rate is lower than the ASTM breakthrough criterion of 1.67E-09, and could
simply not be matched by a reasonable diffusion coefficient profile. This reported
permeation rate is 89 times lower than that reported for methanol in the
natural rubber used in the previous example, and this for comparable
breakthrough times. No explanation of this is obvious.
It is
concluded, however, that permeation through natural rubber gloves can be
modeled by the HSPiP software, with any exceptions to reasonable results
requiring an explanation.
Methylene chloride permeation in Viton gloves
The data
source for the following calculations for methylene chloride (Figure 10),
chloroform (Figures 11a and 11b), and acetonitrile (Figure 12) in Viton is:
Katherine
M. Evans and James K. Hardy, Predicting
Solubility and Permeation Properties of Organic Solvents in Viton Glove
Material Using Hansen’s Solubility Parameters, Journal of Applied Polymer
Science, Vol. 93, 2688-2698 (2004). This is a very careful and thorough study
providing the data needed.
The
breakthrough time for methylene chloride in the given Viton glove material was 38.4
min with a steady state permeation rate of 1.15E-06 g/cm2/s. Figure
10 shows that these values can be duplicated with the diffusion coefficient
profile given in the figure. The ASTM breakthrough time is calculated as 38.3
minutes with a permeation rate of 1.13E-06 g/cm2/s.
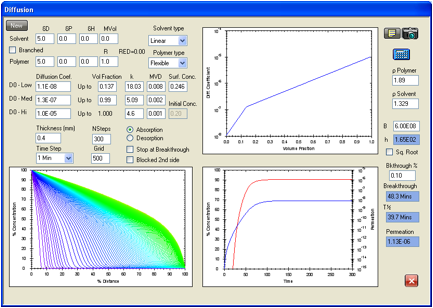
Figure 1‑10 Permeation
of methylene chloride in Viton. The agreement is excellent with the reported
breakthrough time of 38.4 minutes being matched with 38.3 minutes, and the
reported steady state permeation rate of 1.15E-06 g/cm2/s was
matched with a calculated 1.13E-06 g/cm2/s.
Chloroform permeation in Viton gloves
Figure 11
gives a diffusion coefficient profile for chloroform permeation in Viton. There
is a calculated ASTM breakthrough time of 6.87 hours versus an experimental
value of 6.90 hours and a steady state permeation rate of 6.18 g/cm2/s
compared with the value from Evans and Hardy of 4.15 g/cm2/s. It has
not been possible to find a set of parameters to better match both of these
simultaneously. It is possible that a treatment similar to the one presented in
the following for the permeation of acetonitrile could improve the agreement,
but at the same time there is better agreement with another source of
permeation data in this system also reported by Evans and Hardy as shown in
Figure 12. In this second case the calculated value of the ASTM breakthrough
time is 9.3 hours versus an experimental 9.5 hours. The calculated steady state
permeation rate is 4.53E-08 g/cm2/s to be compared with an
experimental value of 4.67E-08 g/cm2/s.
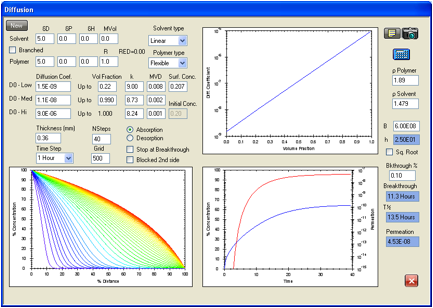
Figure 1‑11 Permeation
data reported by Evans and Hardy for a previous study for chloroform in Viton.
In this case the calculated value of the ASTM breakthrough time is 9.3 hours
versus an experimental 9.5 hours. The calculated steady state permeation rate
is 4.53E-08 g/cm2/s to be compared with an experimental value of
4.67E-08 g/cm2/s.
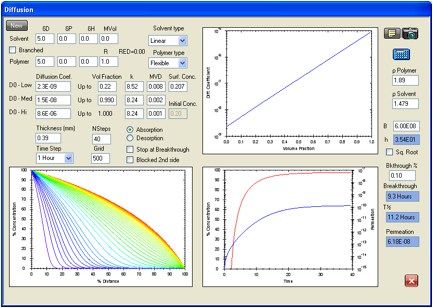
Figure 1‑12 There is a
calculated ASTM breakthrough time of 6.87 hours versus an experimental value of
6.90 hours and a steady state permeation rate of 6.18 g/cm2/s
compared with the value from Evans and Hardy of 4.15 g/cm2/s.
Acetonitrile permeation in Viton gloves
Evans and
Hardy report an ASTM breakthrough time of 13.8 minutes and a steady state
permeation rate of 1.95E-05 g/cm2/s for acetonitrile in Viton.
Figure 13 gives the closest fit found for these values without trying to
explore what a significant surface resistance might do. The data in Figure 13
reproduce the breakthrough time precisely at 13.8 minutes, but the calculated
steady state permeation rate is 1.53E-05 g/cm2/s. While this might
be satisfactory and probably within experimental error, an attempt was still
made to explore the effect of a significant surface resistance.
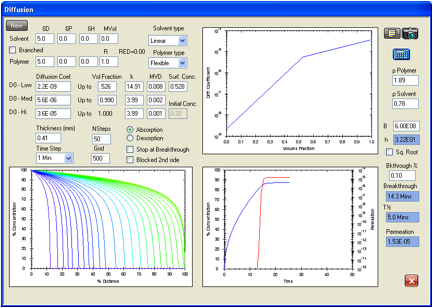
Figure 1‑13 Permeation
of acetonitrile in Viton. Data of Evans and Hardy are reproduced exactly for
the ASTM breakthrough time of 13.8 minutes but the steady state permeation rate
is low at 1.53E-05 g/cm2/s compared with the experimental 1.97E-05 g/cm2/s.
Figure 14
shows the results of a significant surface effect. The change in the input
values is a big reduction in the B value which in turn gives a limiting mass
transfer coefficient, h of 1.27E-04. It is relevant to compare the estimated
diffusion coefficients for acetonitrile (molar volume 52.6) with those of
methylene chloride (molar volume 63.9). One would expect similar diffusion
coefficients based on similarity of size (and shape) when comparing these two
solvents. D0 for methylene chloride is estimated in Figure 10 as
1.1E-08 cm2/s. D0 for acetonitrile estimated with the
inclusion of a significant surface effect is 9.5E-09 cm2/s , which
is close to this, while without the significant surface effect, the D0
is 2.2E-09 cm2/s . This expected similarity also speaks for the
presence of a significant surface effect. The much larger equilibrium
absorption of the acetonitrile is the main difference between these two
solvents in the present context. This allows for very rapid diffusion within
the Viton, and the supply through the surface cannot keep up with the removal
from the surface.
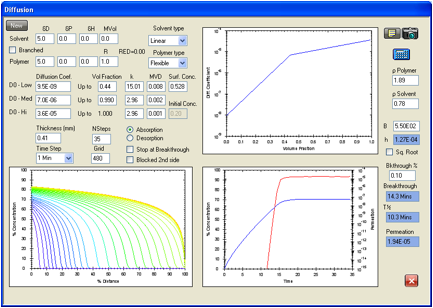
Figure 1‑14 Permeation
of acetonitrile in Viton modeled with a significant surface resistance
generated with a surface mass transfer coefficient, h, of 1.27E-04 cm/s. The
ASTM breakthrough time here is 13.5 minutes compared with the experimental 13.8
minutes and the steady state permeation rate is 1.94E-05 g/cm2/s compared with
1.97E-05 g/cm2/s. The surface concentration at the steady state
permeation condition is 0.832 times the solubility (0.528 volume fraction).
If one
accepts this result, the effects of film thickness can be explored by
maintaining the same h, and changing the thickness. The effect of putting on
two gloves, for example can be estimated by entering a thickness of 0.82 mm
and, neglecting any resistance between the gloves. Here one finds an ASTM
breakthrough time of 39.1 minutes and a steady state permeation rate of
1.32E-05 g/cm2/s. The surface concentration is 0.882 times the
solubility. The rule of thumb that the breakthrough time will be four times as
large for a doubling of the film thickness would have indicated a breakthrough
time of 4 times 13.5 which gives 54 minutes or 13.8 times 4 as 55.2 minutes.
The reason for this difference is the surface condition has less effect on
thicker films on a relative basis, and the higher concentrations in the film
lead to higher diffusion coefficients. The gloves are not quite as safe as
expected based on the rule of thumb.
A similar
analysis of the steady state permeation rate would suggest that doubling the
film thickness would cut the permeation rate in half. This is 0.98E-05 g/cm2/s
compared with the 1.32E-05 g/cm2/s estimated by this calculation.
Again the glove(s) are not as safe as predicted by the rule of thumb because
there is more solvent in the glove, and the diffusion coefficients are higher
than in the reference measurement.
These
calculations should clearly be tested by experiment.
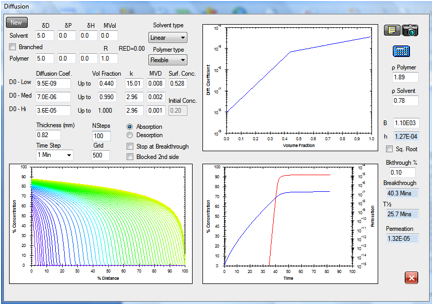
Figure 1‑15 Permeation
of acetonitrile in Viton modeling the effect of wearing two gloves.
The ASTM
breakthrough time is 39.1 minutes and the steady state permeation rate is 1.32E-05
g/cm2/s for a surface concentration that is 0.882 times the maximum
amount that the Viton film can dissolve.
The time-lag
The
time-lag calculation, now available in the Third Edition, was not used in any
of the previous figures in the chapter. The values that would have been found
are reported in the following table for permeation in Viton gloves only. The
study by Evans and Hardy is the only source of the experimental information
used for this purpose, and this is for Viton gloves only. The time-lag is the
time value found by extrapolating the accumulated permeation rate back to zero
amount permeated as seen in Figure 17-16.
|
Figure |
Solvent |
Experimental Time-lag |
Calculated Time-Lag |
|
17-10 |
Methylene
chloride |
55.7 min. |
72.6 min. |
|
17-11 |
Chloroform |
677 min. |
1194 min. |
|
17-12 |
Chloroform |
661.5 min. |
984 min. |
|
17-13 |
Acetonitrile |
25.6 min. |
15.1 min. |
|
17-14 |
Acetonitrile |
25.6 min. |
16.1 min. |
|
17-15 |
Acetonitrile |
- |
- |
|
17-16 |
Acetonitrile |
25.6 min. |
25.2 min. |
From the
above table only marginal change can be seen comparing the time-lag of 15.1
minutes from Figure 17-13, where there is not significant entry surface
resistance in the calculation, to the 16.1 minutes found in Figure 17-14, where
there is. Both are still well below the experimental 25.6 minutes. The
calculated and experimental steady state permeation rates and breakthrough
times match well for the calculations in the latter figure, however. The
time-lag data for the other figures is calculated as being much longer than
measured. The reason for this is not known, but there is a strong suspicion
that this is caused by surface resistance, perhaps mainly on the exit side of
the samples in permeation cells as discussed in the following.
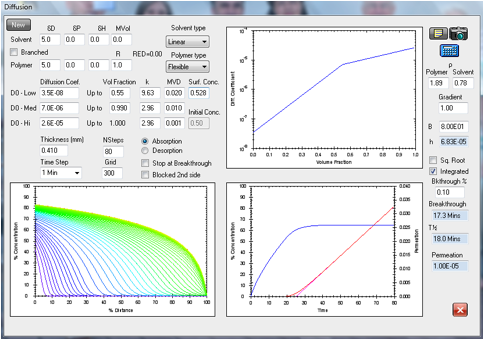
Figure 1‑16 Test of the lag-time calculation in the 3rd
Edition using the system acetonitrile in Viton as in the previous figures. The
experimental time-lag is 25.6 minutes in excellent agreement with the
calculated 25.2 minutes, and calculated breakthrough time of 13.5 minutes
matches the experimental value of 13.5 minutes. However, the steady state
permeation rates are not well matched with 1.00E-05 g/cm2/s
calculated versus 1.95 g/cm2/s found experimentally.
Figure 17-16
gives data that match the lag-time and breakthrough time very well, including a
significant surface resistance on the entry side, but the steady state
permeation rate is much too slow. Matching the
experimental and calculated permeation rates in Figure 17-16 would require a
significantly higher surface concentration while keeping the same diffusion
coefficient profile that gave the good matches in the time-lag and breakthrough
time. This is not possible. Attempts to reconcile this in various ways did not
lead to an improved result. It should be noted, however, that the there are
only two relevant entries in the F/K database for acetonitrile in Viton (both
for North F-091). The one lists degradation and the other a more rapid
breakthrough (6 minutes) than in the example above, although the film thickness
is smaller (0.26 mm). This leads one to suspect that the breakthrough and time
lag data reported in Figure 17-16 are more reliable than are the steady state
permeation data, and that some degradation in the Viton may be responsible for
the higher experimental steady state permeation rate than is predicted by these
calculations.
At this
point in time there is too much variation in literature data and too many
variables to properly assign accurate values to all of the relevant parameters,
but each of the parameters discussed has, or easily can have significance,
particularly for more rapid permeation in thinner samples.
Breakthrough times for low concentration
exposures
It is
possible to predict effects that are very difficult to measure when reliable
diffusion coefficient profiles have been established. One of these is how
quickly breakthrough occurs for a very limited exposure to a challenge chemical.
This is not easily estimated from general permeation data which are typically
measured at high concentrations with pure liquid exposure in permeation cells.
The following tables report breakthrough times for low (constant) surface
concentrations for the Nitrile glove type studied in the above using the
diffusion coefficient profiles for toluene and methanol that were established
in Figures 2 and 4. Like all numerical modelers there is some trade-off of
accuracy (grid size) and speed so the values reported below are somewhat grid
dependent. However it should also be noted that differences in breakthrough
times for toluene with different types of Nitrile gloves far exceed any
numerical uncertainties. For toluene the variation is from a low of about 4
minutes up to a high of 61 minutes. For methanol the variation is from a low of
7 minutes to a high of >480 minutes. One must be very careful with
generalizations. The following is an indication of what is generally expected,
but cannot be considered a complete analysis.
|
C1 |
Breakthrough time |
Dmax/D0 |
|
0.00 |
- |
1.00 |
|
0.01 |
496 |
1.04 |
|
0.02 |
486 |
1.13 |
|
0.05 |
452 |
1.39 |
|
0.10 |
402 |
2.0 |
|
0.67 |
64.3 (61) |
86.9 |
Breakthrough
times in minutes for toluene in the Nitrile glove Ansel Edmont type 37-165 for
given
|
C1 |
Breakthrough time |
Dmax/D0 |
|
0.00 |
- |
1.00 |
|
0.01 |
21.3 |
1.04 |
|
0.02 |
21.3 |
1.08 |
|
0.05 |
20.3 |
1.25 |
|
0.10 |
19.3 |
1.54 |
|
0.32 |
11.3(11) |
4.08 |
Breakthrough
times in minutes for methanol in the Nitrile glove Ansel Edmont type 37-165 for
given values of the surface concentration, C1, in volume fraction.
These data
emphasize once more the importance of keeping diffusion coefficients low, one
way or another, to keep breakthrough times long.
Practical implications
It’s a good
idea to remind ourselves why we’ve gone to such lengths to analyze all that
data. The reason is that it matters! The safety of real people with real
chemicals depends on these analyses.
The problem
is that there are many more chemicals than there are people to do the careful
measurements of breakthrough times and permeation rates. We therefore need
rational ways to arrive at the best choice of glove.
We’re
already off to a good start. From the above analysis we can say that the
majority of the D0 values of interest to glove safety will lie
between the limits of about 1E-09 cm2/s for larger molecules and
about 1E-07 cm2/s for smaller molecules with an average near 1E-08
cm2/s. Figure 1 gives you an idea of how to estimate relative D0
values if (as is usually the case) you don’t have the resources to measure them
yourselves.
It is also
clear that a greater HSP distance is required for safety when the molecules are
smaller or more linear. Solvents with smaller molecules often appear as
outliers in simple HSP correlations, getting through the glove more quickly
than expected. Conversely experience has also shown that the phthalate
plasticizers, for example, do not get through given glove types quickly, in
spite of good matches in HSP with the glove materials. The reason for this is
clearly portrayed above as a very low D0.
For
molecules beyond simple solvents and plasticizers, a method to improve the
simplest HSP analyses in such situations has been given in Chapter 12. This
uses the example of Neoprene gloves with a 1 hour breakthrough time. HSP can
lead to reasonable predictions of breakthrough times for complex chemicals. If
you have the luxury of more data then you can use the techniques described in
this chapter to provide even better information.
Wearing two
pairs of gloves, or a gloves of twice the thickness, gives four times the
protection against diffusion and gives extra protection against accidental
tears or punctures.
There will
be times when simple estimates can lead you astray. As the acetonitrile/Viton
example shows, without knowing that there is a strong surface resistance, the
“twice the thickness gives four times the protection” guide leads to a false
conclusion. However, most of us would not want to use gloves that so obviously
loved to absorb so much solvent. Once again, a large HSP mismatch is a much
better idea.
Because D0
is usually lower in more rigid polymers than in more flexible polymers, the
cautious user might like to go for a glove made from, say, polyethylene. But of
course its very rigidity (lack of comfort) and the ease with which it is torn
are often good reasons for not using it.
In summary,
as in the previous chapter, the intelligent use of whatever data is to hand can
lead to reasonable and defensible conclusions. In the absence of any other data
then the best rule of safety is to maximize the HSP distance between the glove
material and the challenge chemical with a glove material that is as flexible
and comfortable as possible.
E-Book contents | HSP User's Forum