How
to use Polymers
The Polymers table is filled by the
data in DefaultPolymers.pds which you should feel free to edit provided you
keep the simple Tab-separated file format, or alternatively you can edit it
from within the program and Save it.
We have to stress the difficulties in
providing a Polymers table. We are often asked “why are there multiple entries
for a single polymer?”. There are a few reasons. The first is the obvious one
that the “same” polymer can be very different depending on purity, molecular
weight, tacticity, % accidental or deliberate cross-links and so forth. The
second is that a polymer can be measured for different reasons – swelling might
be important for one purpose whereas full dissolution might be required for
another. The third is that there are a lot of excellent data out there that are
closely protected by confidentiality. If a research group has put a lot of
resource into measuring the HSP of their polymers, they don’t see why others
should have free access to their hard work.
For the 3rd Edition we’ve
added a “reliability rating” column with ratings from 1 to 6:
1: Good to Excellent quality
2: Some improvement would be possible in
data quality
3: Considerable improvement possible in
data quality
4: Only useful for an estimate with great
uncertainty
5: Probably should be deleted, but there
may be an indication for some purpose
6: Should be deleted, but there may be an
indication for some purpose
We’ve also included some “Further
comments” that for some polymers provide extra insight to the ratings.
But until the major polymer companies get
into the habit of providing their customers with high-quality data for their
polymers, the HSP community has to make do with this polymer table – or with
measuring the polymers themselves. We are always happy to include datasets on
polymers to the HSPiP community. If you send them in, we’ll make sure that
everyone benefits.
To close the Polymers form, click the X Close button on the form.
The data are an updated version from the
second edition of Dr Hansen’s book (with permission) and the “Comments” field
is the classification of polymer type used there.
To help find a polymer you can use the Search option which works exactly as described for the solvents.
You can do three things with the polymer
data
1 Solvents. When you click the Solvents button, the Solvents list gets sorted by
RED number with respect to your currently selected polymer.
The lower the RED the better the match of
solvent to polymer. The RED can be calculated either from the arbitrary
Double-Click Radius or (if you select Use
Polymer R)
from the Radius of your selected polymer. The ordering is unchanged, just the
values and the graphics.
If you select a number of polymers then Solvents will order the solvents by the highest
RED of each solvent with the selected polymers. You can choose to Use Polymer R if you want the REDs to reflect the
different polymer radii, or deselect it if you want a comparison using the Double-Click
Radius. Why are the ordered by the highest RED? There isn’t a meaningful way to
make “averages” of REDs. Suppose, for example, that one solvent has a RED of 0
and another a RED of 2. The average would be 1, which says that this polymer
combination is borderline compatible with that solvent, which, of course, it
isn’t. It seems better to show the worst-case (in this example that is 2) to
show you that this solvent will never be acceptable for combining these two
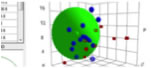
polymers. The graphs and 3D plot get a bit more complex as they are showing
multiple pieces of information, but you should get the hang of what is going
on. Selecting multiple polymers is the same as selecting multiple files in
Windows Explorer: Shift-Click selects all polymers from the previously selected
polymer to the one where you Shift-Click; Ctrl-Click simply adds each new
polymer to the selection. This multiple polymer selection trick also lets you
see the different polymer sphere overlaps.
When you click Solvents, some key data
are placed in the text box on the main form. If you have just one polymer then
its name and HSP are shown. If you have multiple polymers then you get their
names and HSP plus an estimate of the Junction value – the sweet spot
which would define the solvent most likely to interact well with each of the
polymers.
You may prefer to select the WF (wire frame) view so you can see inside your different
polymer spheres.
If you save the result as a .hsd file,
the SphereView Power Tool lets you view the output clearly.
2 Polymers. First select a solvent
from the Sphere form. Then click the Polymers
button.
The polymers will now be ordered with respect to that solvent’s RED number with
respect to each polymer. Again the RED number depends on which definition of R
you choose.
3 Double
click polymers.
When you double-click (or Alt-Click) on a polymer, the polymers get sorted by
their degree of spherical overlap with your target.
You get two values for each polymer. The
first number is the percentage by volume of your target polymer that is
occupied by the other polymer. The second number is
the percentage by volume of the other
polymer that is occupied by
your target polymer. Why two values? A
polymer with a small radius might be entirely within the radius of the other
polymer. So the first would overlap by 100%, but the second may (if the
difference in radius is large) only overlap by 30%. Clearly if either figure is
close to 100% you can assume that the two polymers would be mutually compatible
and if both figures are low then you can expect that they could form two phases
on mixing.
The method of sorting uses the highest
overlap in either direction with a sub-sort depending on the overlap in the
opposite direction. So 100 / 60 is higher than 100 / 40 but 90 / 100 is higher
than 100 / 60.
If you have a target polymer, not
included in the database, then you can enter it in the bottom row of the
polymer table and double click on it.
If you want to restore the view to
original, click the Clear button.
If you update your polymer table with new
or added values, then you can click the Save button and a new
version of Polymers.dat will be saved. The old version will be backed-up as Polymers.bak.
The Theory button takes you into
the form that describes the basic solubility calculations for polymers, as
described in the eBook.
By clicking the O Optimizer button you
automatically open the Solvent Optimizer as described in the Optimizer section.
For a permanent record, click Capture Screen to Clipboard camera button. You can then paste the image into Word etc.
Finally, by clicking the Copy to Table table button you can place the contents
of the Polymer table on the Clipboard for pasting into e.g. Word or Excel.
If you just want a simple printout of
your table then click the Print Table button. If you want
fancier printing then use Copy to Table to place the data in Excel and use the
many options there for fancy print formatting.