Power
Tools
The long-term future of computing is
“apps” that are not tied to any specific computing platform. Therefore in the
long-term HSPiP must lose its dependence on the PC platform and the DotNet
computing framework. Although many will rejoice when it is no longer necessary
to get IT to install HSPiP with Admin privileges, it will be a very long time
before the alternative (HTML5/CSS3/JScript) running from browsers will be
acceptable. To take a simple example, it is currently not possible (for security
reasons within a browser) to do something as simple and obvious as saving a
.hsd file to a convenient folder.
So, HSPiP in PC format will be with us
for a long time and the latest version contains some significant improvements
and extra functionality.
However, for those who want significant
extra power in areas that are not central to the running of HSPiP, it seems a
good idea to provide such functionality in the format of the future. That’s
what Power Tools are. You can find them by clicking the Power Tool menu item
which opens PowerTools.html in your default browser (see below) which in turn
contains links to the various tools available. Of course, power users can just
find the relevant index.html files in the Power Tools folder under HSPiP Data
if they want to access the tools directly.
For
security reasons no internet access is required by any Power Tool or component.
Everything runs on your local machine in your favourite browser.
The most important Power Tool is SphereView. This allows you to send a .hsd file to
a colleague who does not have HSPiP and they simply run the Power Tool in their
own browser and load the .hsd file. SphereView also adds a few extra viewer
features for looking at files.
Even this most basic of Power Tools comes
with practical issues. Up-to-date versions of Chrome, Firefox, Safari and Opera
run it with no problem. But IE9 is crippled by its inability to load a simple
file (so users have to paste hsd data into it) and IE10 has a number of
oddities that might limit its capabilities. IE8 simply doesn’t cope with HTML5.
So for those in corporate environments that force the poor users to have IE8,
well, sorry, it’s not our fault that the new world of apps is not available to
you. For those who have freedom of browser choice, if you want to invoke Power
Tools from HSPiP, make sure your default browser is Chrome, Firefox or Opera,
or that if you use IE it is IE10. For those who have IE9 it is not possible to
load a .hsd file so data have to be transferred by opening the .hsd file in a
text editor such as Notepad, copying it, then pasting it into the input box in
the Power Tool. Don’t blame us that IE9 is so flawed and that IE10 continues to
pursue ways of doing things that are different from all other browsers – for
example, in other browsers you need check for your license file only once, in
IE10 we have no way to store the fact that you have done so, and it asks you to
check each time.
On Android and Surface tablets which have
a file structure you can run SphereView normally. Via copy/paste it is even
possible to run SphereView on an iPad, which famously does not allow users to
handle files in a normal manner.
Turning to the positive, the great news
about Power Tools is that they are lightweight and easily deployed and updated.
So if your corporation don’t allow you to have regular updates of the main
HSPiP, you should still be able to keep up-to-date with the ever-expanding
range of Power Tools. The only technical knowledge required is how to unzip a
new or improved Power Tool into the right folder under HSPiP Data. If you don’t
know how to do this then you really do have to wait for the next upgrade to
HSPiP which will always install the latest set of Power Tools.
Most of the tools require you to have a
valid HSPiP license – these tools are part of HSPiP and we’re not giving them
away to non-users. The first time you run one of the Power Tools it asks you to
find the license file (typically in c:\program files
(x86)\Hansen-Solubility\HSPiP) but once you’ve shown the file to one Power Tool
you won’t be asked again. Obviously SphereView does not require access to a
license (we want it to be used by your colleagues). Those who have a valid
HSPiP license will also find that other HSP development apps on the www.pirika.com site which are for restricted use will automatically open without
further passwords or registration.
Sphere Viewer
When
using HSPiP, browsing solvents and solutes in Hansen 3D Space is very useful to
understand solubility phenomena. But if you want to share your finding with
your co-worker, you can send only screenshots if your co-worker is not an HSPiP
user.
So,
we present you HTML5 base software, "SphereView" as a Power Tool of
HSPiP. The owner of HSPiP are allowed to distribute SphereView and your data
file (.hsd) to the others.
Browser
support:
|
|
Mac |
Windows |
Linux |
|
Chrome (ver. 23) |
◯ |
◯ |
|
|
FireFox (ver. 17) |
◯ |
◯ |
|
|
Safari(ver. 6-) |
◯(OSX, Lion+) |
? |
|
|
Opera (ver. 12) |
X (File API X) |
◯ |
|
|
IE (ver. 10) |
- |
◯ |
|
IE
6-8 does not support HTML5. IE-9 does not support FileAPI so can not open data
files. The most stable browser is Chrome.
If
your co-workers use one of these HTML5 browsers, this SphereView allows you to
securely share 3D Hansen Space data with them as SphereView does not use any
external internet access.
Running
the program
Please
open index.html with a suitable HTML5 browser. (By clicking with right button
and select open with application or by dropping index.html onto the browser
icon or, from HSPiP, clicking the PowerTools menu option) Then you will see the
next startup screen. The language (English or Japanese), Button name and
appearance are dependent on your browser. If you change the size of the browser
window, the Canvas size is also changed according to Window size.
How to
Use
SphereView
can read .hsd(Hansen Sphere Data) format datafiles. If you want to read a
previous .ssd format file, please open it with HSPiP and save it in .hsd
format.
If
you click the Choose File button, you will be able to open files on your local
disk. For practice purposes, find the files in your MyDocuments/HSPiP
Data/Examples folder. For example, please select Chapter2.hsd from that folder.
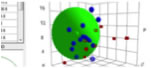
Sphere Viewer reads the file and displays it as below. For this type of file,
the Score is 0 (outside sphere:color red) or 1(inside sphere: color blue) so
the 0-1 system is assigned. If you drag inside the canvas, 3D Hansen space will
rotate.
Click
on any solvent and you will see the Hcode(Hansen compounds code) and solvent
name.
From
HSPiP ver. 3.1, the dH(Hydrogen bonding term) was split to dHdo(Donor) and
dHac(Acceptor) term. From the definition, dH^2=dHdo^2+dHac^2, the position in
Hansen Space is not changed. When the Donor/Acceptor option is selected, the
color of the solvent means the ratio of of donor/acceptor. The blue color means
donor nature solvents such as carboxylic acids. The red color means acceptor
nature solvents such as amines. The green color means solvents have dual nature
such as alcohols. The brightness of the color means the absolute dH value. For
this appearance, we use color for ratio of of donor/acceptor and we can not
distingush "inside"/"outside" solvents, so we adopt the HSPiP
convention that "inside" are spheres and "outside" are
cubes.
Please refer to e-Book, Into the 4th Dimension. Donor/Acceptor
We
also have the option to view solvent volume size. The solvents that are
"inside" the polymer Sphere even though they do not dissolve the
polymer, sometime are too large and can not penetrate into the polymer. You can
confirm this effect with this option. It is similar to the MVC option in HSPiP
If
you read hsd datafiles that are scored on the 1-6 system, SphereView displays
1's as red, 6's as blue with a blue to red gradation for scores in between.
Shift-Drag
zooms the view.
Alt-Drag
pans the view.

If
the scores are real numbers (for quatitative analysis), the color is changed
based on the average value of the score.
If
you calculate the Sphere with HSPiP, then save the hsd data, HSPiP appends the
Sphere information to the solvent data.
Calculate
Sphere.
Save
with a different name.
If
you open that file with a text editor, you will see the "Previous
Data" after the solvent data.
If
you open such an expanded hsd datafile with SphereView, you will see the
solvents with the Sphere. Remember, you can send SphereView and hsd data to
your co-worker, and they can browse the 3D Hansen space even if they are not
HSPiP users. Because SphereView works on your local machine and is not
connected to the external internet in any way there is no exposure of your
confidential hsd data.
Open
that file.
View
of hsd + Sphere.
With
HSPiP, if you check the GA option, and calculate Advanced Sphere Fitting,
Double Sphere you will produce a double sphere.
You
can browse the double sphere with SphereViw.
If
you use the Solvents option in Polymers within HSPiP you can save the hsd files
with your multiple polymers, which can then be viewed in SphereView. You can
also add up to 5 spheres if you edit the hsd file manually.
Finding Hansen Sphere,
Y-Fit
2012.Dec.21
We
already have the HSP values of solvents. So we can plot those solvents in 3
dimensional (3D) space. Suppose, we have some solute (typically polymer) and
set solvents' color blue that dissolve the solute, and set solvents' color red
that do not dissolve the solute. If we view the colored solvents in 3D space,
we will notice that the blue colored solvents are clustered and can fit into a
Sphere. The program to get this sphere center and radius is a core routine of
HSPiP. We have been developing many algorithms to determine these values and to
use the visual information to understand solubility phenomena. Recently, we
divided the Hydrogen bonding term (dH) into dHdo(donor) and dHac(Acceptor). And
HSP became 4 Dimensional (4D). We need to design new Hansen Sphere viewer for
viewing these alternative fits to see which best fits our data. For
determination of Sphere Center and Radius, we present you HTML5-based software,
"Y-Fit" as a Power Tool of HSPiP.
Browser
support:
|
|
Mac |
Windows |
Linux |
|
Chrome (ver. 23) |
◯ |
◯ |
|
|
FireFox (ver. 17) |
▲(Web Storge X) |
◯ |
|
|
Safari(ver. 6) |
◯(OSX, Lion+) |
? |
|
|
Opera (ver. 12) |
X (File API X) |
◯ |
|
|
IE (ver. 10) |
- |
▲(Web Storge X) |
|
IE
6-8 does not support HTML5.
IE-9
does not support FileAPI so can not validate license file.
IE-10
has a problem in Local Storge and users need to validate every time.
Opera
for Mac does not support FileAPI.
FireFox
for Mac has a problem in Local Storge and users need to validate.
We
strongly recommend Chrome browser.
Run
the program
Please
open index.html with an adequate HTML5 browser. (By clicking with right button
and select open with application or drop index.html to alias of browser icon
or, from HSPiP, clicking the PowerTools menu option) Then you will see the next
startup screen. The language (English or Japanese), Button name and appearance
are dependent on your browser. If you change size of browser window, the Canvas
size is also change according to Window size.
Start
up screen.
Validation
The
first time you run a Power Tools, you need to register your HSPiP License File
to the browser. Please click Choose File button (Button name and appearance are
dependent on browser) and select your HSPiP License File, typically in
c:\program files (x86)\Hansen-Solubility\HSPiP.

Once
you open the License File, the browser stores the information locally and every
Power Tools will run without verification. (IE10 does not handle local storage
properly and users need to validate every time)
How to
Use
After
Validation, you will see the below window. (You may need to reload the browser)
This
Y-Fit program can read .hsd(Hansen Sphere Data) format datafiles. If you want
to read the previous .ssd format file, please first open it with HSPiP and save
it as hsd format. If you click Choose File button, you will be able to open
files on your local disk. For practice purposes, find the files in your
MyDocuments/HSPiP Data/Examples folder..
0-1
System
For
example, please select Chapter4.hsd. Y-Fit reads the file and displays it as
below. In this file, the Score is either 0 (outside sphere:color red) ,
1(inside sphere: color blue) so the 0-1 system is assigned. If you drag inside
the canvas, 3D Hansen space will rotate. If you click on a solvent, you will
see the Hansen Solvent code (HCode) and solvent's name
Shift-Drag
zooms the view and Alt-Drag pans the view.
From
HSPiP ver. 3.1, the dH(Hydrogen bonding term) was split to dHdo(Donor) and
dHac(Acceptor) term. From the definition, dH²=dHdo²+dHac², so the position in
Hansen Space is not changed. When the Donor/Acceptor option is selected, the
color of the solvent means the ratio of of donor/acceptor. The blue color means
donor nature solvents such as carboxylic acids. The red color means acceptor
nature solvents such as amines. The green color means solvents have dual nature
such as alcohols. The brightness of the color means the absolute dH value. For
this appearance, we use color for ratio of of donor/acceptor and we can not
distingush "inside"/"outside" solvents, so we adopt the
HSPiP convention that "inside" are spheres and "outside"
are cubes.
Then
please click the Fit pane(Green tab), you will see the options that apply to
the 0-1 system.
At
first you need to assign HSP distance scheme. The normal HSP distance scheme
is,
HSP
distance= Sqrt(4.0*(dD1-dD2)²
+ (dP1-dP2)² +(dH1-dH2)²)
(Sqrt:Square
root)
If
you want to calculate 4 dimensional(4D) HSP distance (please check Split dH,
the Canvas view will be changed), next scheme will be adapted.
4D
HSP Dist.= Sqrt(4.0*(dD1-dD2)² + (dP1-dP2)² +(dHdo1-dHdo2)² +(dHac1-dHac2)²)
These
are the most basic distance schemes in HSP.
If
you want to calculate 4D HSP distance, you can select Beerbower distance
scheme.
Beerbower
Dist.= Sqrt(4.0*(dD1-dD2)² + (dP1-dP2)² +2*(dHdo1-dHdo2)*(dHac1-dHac2))
If
your target solute has large donor/acceptor interactions, the Beebower distance
may work effectively, but solvents and solute distance viewed in 3D space
become meaningless.
Click
Fit with no options selected, you will see the View Pane.
The
program found [dD, dP, dH]=[17.21, 9.02, 5.92] and Radius=7.9 sphere. Check the
right side checkbox, you will get the 3D view of solvents and Solute.
You
can use the 4 other Sphere data boxes as you like. If you want to check a
polymer's compatibility with the first solute, enter its HSP and radius and
check the box to its right. If you want to check new solvents for this system,
enter their values and view the solvent locations.
Go
back to the Fit pane, all the results are listed in the textbox, so copy
them and paste to Spread Sheet if you want to examine then further for
analysis. The last column is a fitting quality parameter where smaller is
better. You sometimes get a better fit quality but with a larger radius than
the #1 value – it is up to you to decide which is more suitable for your
system. Now check Split dH (The Canvas view will change).
(The
color of the solute means nothing because dHdo/dHac of solute are not
calculated yet.)
Then
click the Fit button.
The
dHdo=0.57, dHac=7.34 so this solute's nature is that of an Acceptor and the
Sphere color becomes blue.
If
you check the Double Sphere option, the program searches for 2 spheres that
match Score=1 solvents located in either of the 2 spheres, and Score=0 solvents
locate in neither of the 2 spheres.
The
result of Double Sphere.
If
you read Neoprene.hsd example and Fit, you will see several Score=0 solvents
are locate inside Sphere(Wrong in). Check the Solvent MVol to Radius option,
All such Wrong In solvents' molecular volume are very large. Click the solvent,
then you will see the HCode and solvent name. You will find out those solvents
are Phthalic esters. The Phthalic esters are used as plasticizer of polymer,
and the plasticizer needs to dissolve in the polymer but must not bleed out.
Then similar HSPs and large molecules are used for plasticizers. Plasticizer
are poor solvents because they are too large and can not penetrate into
polymers.
1-6
System
From
the Read pane, please load the Polymer88A.hsd file.
For
this file, the score is 1-6 system. Score=1 means the best solvents, and
Score=6 are poor solvents. For this 1-6 system case, you need to set which
scorer are assigned as inside. in the Fit pane, you will see the textfield and
View button to press when you have changed the score. At first, solvents are
colored by score.
If
you set inside as 2, Score 1-2 solvents are colored blue, and 3-6 solvents are
colored red. You can change the definition of "inside" as many time
as you like. Remember to confirm the effect by clicking the View button.
If
you set 4 as inside.
When
you click the Fit button, Sphere will be searched with the textfield value.
All
the options are same with 0-1 system after you set inside.
Score=1(complete
dissolve)
Score=2(Swelling
>100%)
Score=3(Swelling
>70%),
Score=4(Swelling
>30%)
Score=5(Swelling
>10%)
Score=6(Swelling
<=10%)
If
you set Score like above, and changing inside 1 to 5. The Sphere center and
radius will be different according to inside value. That will be helpful to
understand your polymer solubility.
Real
data
The
HSP concept of solubility is generally a Qualitative analysis. We just select
soluble (Score=1) or not soluble (Score=0). Even if we apply the 1-6 system, we
only change the boundary of what we call soluble or nor soluble. In general,
the nearer to the sphere center, the larger the solubility. But sometimes we
encounter negative results.
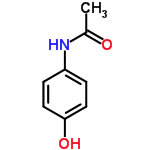
For
example, in the case of solubility of Paracetamol, suppose the solubility of
solvent, log(g/Kg solv.)>2.0 set score=1 and otherwise score=0. That is 0-1
system and we can easily find Sphere like below.
The
center of Sphere becomes [17.65, 14.7, 17.49] and the radius is 9.45. There are
2 Wrong out solvents. If we plot this result as HSP distance vs log Solubility,
you can find the correlation "The shorter HSP distance, the larger
Solubility".

But
look carefully!
If
you want to try new solvents and you get HSP distance=15, can you estimate how
much that solvents dissolve Parcetamol? How about HSP distance=8? The answer is
“Yes” but the error margins are rather large..
From
HSPiP ver 3.1, the Real data handling algorithm was added as a GA option. This
algorithm searches the sphere center so the correlation factor between HSP
distance and real solubility becomes maximal. Which solvents have the maximum
extraction power? Which solvents make the reaction fastest? What will be the
HPLC retention time of certain chemicals? This function is widely used.
For
example, if you read Paracetamol.hsd file, the data type is assigned Real Data.
With our experience, you will get much better result if you take logarithm of
solubility. And you'd better to set the data as "the shorter HSP distance,
the more soluble". In HSPiP you have the option to invert the score value
if the data are opposite - such as "amount left over when filtering the
solution".
If
you select Fit Pane, new option "Variable Coefficients" is added.
(For real data you can not select Double Sphere)
Without
options, just click the Fit button, you will get this result. For this real
data handling, radius means nothing, so enter 7 for the purpose of visual
effect.(If Radius=0, nothing appears)
Normal
distance calculation in HSP is
HSP
Distance=sqrt(4.0*(dD1-dD2)² + (dP1-dP2)² + (dH1-dH2)²)
Let's
browse this result with Spread sheet.
In
an hsd file, dHdo and dHac is separated with / and this can not be handled as
two numbers in the spreadsheet. You need to replace / with tab using a text
editor.
And
add the normal distance scheme.
You
can plot the result.
The
correlation is much better compair to 0-1 system. With this result, if the
solvent's HSP is [19.01, 18.29, 18.85], the distance becomes 0 and the
solubility is expected to be maximum.
Variable
Coefficients Algorithm
If
you calculate Paracetamol with Y-Predict, you will get [dD, dP, dH, dHdo,
dHac]=[20.2, 13.3, 14.7, 11.6, 9.0]. Compare to the previous Fit result,
[19.01, 18.29, 18.85], the dP difference is very large. Then we have the
question whether the coefficients of HSP distance, (4,1,1,(1)) are adequate for
quantitative analysis. So I made a new algorithm to Fit both HSP values and
Coefficients value.
If
you apply this Variable Coefficients option, The Sphere center become [18.16,
14.22, 18.23], and the Coefficients become [3.85, 1.52, 0.38].
So
the new HSP distance calculation scheme becomes as follow.
HSP
distance=sqrt(3.85*(dD1-dD2)² + 1.52*(dP1-dP2)² + 0.38*(dH1-dH2)²)
The
difference of dH will not work so much because the coefficients of dH is just
0.38, but the difference of dP works strongly because its coefficients is 1.52.
We can understand solubility phenomena more accurately.
Let's
browse the correlation of this result.
There
are 2 exceptions but the correlation becomes so beautiful.
You
can use the Split dH option.
You
will obtain HSP[19.63, 14.06, 7.89,13.71], Coeffcients(4.38, 1.78, 0.24, 1.52).
This
result is very close to the Y-Predict estimation [dD, dP, dHdo, dHac]=[20.2,
13.3, 11.6, 9.0].
With
this method, the coeffcients are dependent on solute. In other word, we fail to
find universal HSP distance scheme for 4D Hansen (I mean a universal
Donor/Acceptor interaction cross term).
I
applied this Variable Coefficients option to many case, and in every case the
Variable Coefficient 4D improves the correlation factor for quantitative
analysis.
How to use Draw to Smiles
The
input format for chemical calculations in HSPiP are SMILES, InChI and MOLfile.
There is no GUI input of molecular structure. But if you want to enter polymer
smiles, you need to set dummy atoms (X) either end of the SMILES notation which
is difficult to do by hand.
So,
we present you with HTML5 based software, "Draw2Smiles" as a Power
Tool of HSPiP.
Browser
support:
|
|
Mac |
Windows |
Linux |
|
Chrome (ver. 23) |
◯ |
◯ |
|
|
FireFox (ver. 17) |
▲(Web Storge X) |
◯ |
|
|
Safari(ver. 6) |
◯(OSX, Lion+) |
? |
|
|
Opera (ver. 12) |
X (File API X) |
◯ |
|
|
IE (ver. 10) |
- |
▲(Web Storge X) |
|
IE
6-8 does not support HTML5.
IE-9
does not support FileAPI so can not validate license file.
IE-10
has a problem in Local Storge and users need to validate every time.
Opera
for Mac does not support FileAPI.
FireFox
for Mac has a problem in Local Storge and users need to validate.
We
strongly recommend the Chrome browser.
Run
the program
Please
open index.html with an adequate HTML5 browser. (By clicking with right button
and select open with application or drop index.html to alias of browser icon
or, from HSPiP, clicking the PowerTools menu option) Then you will see the
following startup screen. The language (English or Japanese), Button name and
appearance are dependent on your browser. If you change size of browser window,
the Canvas size is also change according to Window size.
Start
up screen.
Validation
The
first time you run a Power Tools, you need to register your HSPiP License File
to the browser. Please click Choose File button (Button name and appearance are
dependent on browser) and select your HSPiP License File, typically in
c:\program files (x86)\Hansen-Solubility\HSPiP.

Once
you open the License File, the browser stores the information locally and every
Power Tools will run without verification. (IE10 does not handle local storage
properly and users need to validate every time)
Drawing
The
light blue part is called the canvas in HTML5. The actual drawing is done on
this canvas. Other buttons, radio buttons, text fields, text areas previously existed
as a form object. CSS controsl position, size, color and appearance in HTML5.
Therefore, if your browser does not support HTML5, you cannot see the canvas,
and position of the parts looks a mess. If you change browser window size, the
Canvas size also changes automatically.
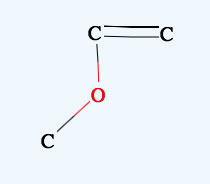
Above
picture, using a carbon atom, Draw mode is selected.
Then,
press the mouse button inside the canvas and drag (without releasing the mouse
button or finger) the position, you will see the drawing like below.

While
pressing the mouse left button, you will see the atom that you selected with
the radio button, and will see the bond. If you move the mouse, the bond will
re-draw at 15 degree intervals.
If
the position where you release the mouse button is not identical to the first
atom, the program put atoms on either end of bond. When the mouse moves near to
an atom, that atom is detected an a pattern appears to show this. If you click
when the pattern appears, you will select that atom. If you click before the
pattern appears, a new atom will be created. So if you want to draw a large
molecule, do it very slowly. It needs time to check if the mouse is pointing at
an atom.
If
you select another atom with a radio button, that atom will be used in drawing
or for replacing.
If
you click the mouse on one atom, and release immediately, that atom will
replace the selected atom.
Please
select Erase mode. The background color is changed to remind you that you are
in a different mode.
If
you move the mouse on to an atom, (the pattern will appear), then left click
and release, the atom will disappear. If you move the mouse between two atoms,
two patterns will appear, then left click and the bond will disappear.
 →
→
Set
Draw mode again.
If
you want to make a double bond, move the mouse on the first atom (confirm that
the pattern appears) then left click and drag to the other atom. When you see
the pattern, release the mouse button and you will get a double bond.
 →
→
When
you Alt drag (option key for Mac) you can move the molecule inside the canvas.
If you Alt+Drag on one atom, you can move only that atom.
 →
→
Shift+Drag
Zooms the molecule.
 →
→
(On
a touchpad remember to unclick before you release the Alt or Shift key,
otherwise you will draw a new atom by accident)
When
your structure is complete, click the Make button, you will get Smiles
molecular structure.
Please
check the functional group list so as to confirm that the molecular break by
computer is correct. You will see the HCode(Hansen Code) if it exists.
If
you want to get Polymer Smiles, please select the Po “atom” to indicate the
repeating unit. Inside the polymer smiles, X atoms are used, and X atoms are
set to either end of the repeating unit.
For
Nitro Compounds, please write like below.
It
is very important to be careful with the mouse moves, if you want to build very
large molecule. Be patient and confirm that the pattern appears before
clicking.
How to use Y-Predict
2012.Dec.19
Y-Predict
is Thermo-Chemical properties estimation program. These estimation schemes were
developed by pirika.com. The indivisual theories and correlations are listed on
pirika.com.
The
input format for chemical calculations in HSPiP are SMILES, InChI and MOLfile.
There is no GUI input of molecular structure.
Now,
we present you HTML5 base software, "Y-Predit" as a Power Tool of
HSPiP.
Browser
support:
|
|
Mac |
Windows |
Linux |
|
Chrome (ver. 23) |
◯ |
◯ |
|
|
FireFox (ver. 17) |
▲(Web Storge X) |
◯ |
|
|
Safari(ver. 6) |
◯(OSX, Lion+) |
? |
|
|
Opera (ver. 12) |
X (File API X) |
◯ |
|
|
IE (ver. 10) |
- |
▲(Web Storge X) |
|
IE
6-8 does not support HTML5.
IE-9
does not support FileAPI so can not validate license file.
IE-10
has a problem in Local Storge and users need to validate every time.
Opera
for Mac does not support FileAPI.
FireFox
for Mac has a problem in Local Storge and users need to validate.
We
strongly recommend Chrome browser.
Run
the program
Please
open index.html with an adequate HTML5 browser. (By clicking with right button
and select open with application or drop index.html to alias of browser icon
or, from HSPiP, clicking the PowerTools menu option) Then you will see the next
startup screen. The language (English or Japanese), Button name and appearance
are dependent on your browser. If you change size of browser window, the Canvas
size is also change according to Window size.
How
to Draw molecules is the same as Draw2Smiles, so pictures are from that help
file.
Start
up screen.

Validation
The
first time you run a Power Tools, you need to register your HSPiP License File
to the browser. Please click Choose File button (Button name and appearance are
dependent on browser) and select your HSPiP License File, typically in
c:\program files (x86)\Hansen-Solubility\HSPiP.
Once
you open the License File, the browser stores the information locally and every
Power Tools will run without verification. (IE10 does not handle local storage
properly and users need to validate every time)
Drawing
The
light blue part is called the canvas in HTML5. The actual drawing is done on
this canvas. Please refer to Draw t
Smiles for drawing molecules.
It
is very important to be careful with the mouse moves, if you want to build very
large molecule. Be patient and confirm that the pattern appears before
clicking.
(On
a touchpad remember to unclick before you release the Alt or Shift key,
otherwise you will draw a new atom by accident)
When
your structure is complete, click the Predict button, you will get the
properties of this molecule.
Please
check the functional group list so as to confirm that the molecular break by
computer is correct.
Please
select the calculated results and copy(Ctr-C).
You
can paste(Ctr-V) to spread sheet and arrange as you like.
Ant1T35:
The temperature that vapor pressure become 1mmHg
You
can choose a parameter set with pulldown menu, so if you want to calculate with
previous version parameter sets (for historical consistency), please select
that version. HSPiP 3rd Edition used Y-MB Ver 3.1. Y-Predict calculates atomic
charge with 2D-QEQ method. (Program automatically adds hydrogens for QEQ
calculation, but hydrogens are not displayed in this version. If I get feed
back from many users that they want to see the hydrogens, I will increase the
priority of programing.)
The
maximum atom number is set to 120 as heavy atom (same with HSPiP), but these
thermo-chemical properties estimation become meaningless if the boiling point
become above 700K. Please use carefully to that chemical's result.
For
the next version of Y-Predict, I will build several estimation schemes
according to chemical types.